Investing and trading sound easy but both these ways of making profits can be tough for the most experienced players. Traders and investors who are skilled at manoeuvring assets and investments to make profits use many strategies at their disposal.
Most of these are based on the principles of technical analysis involving the skillful reading of charts and using other analysis measures. When you open Demat account as a first step in your trading activity, you may not know that you must employ effective strategies that make your trading profitable.
If you are indulging in swing trading, there are some best indicators for swing trading you can pay attention to. The main thing to realise is that by adopting a trading strategy like swing trading, technical indicators help to potentially make trades profitable and lessen losses.
Swing Trading Explained
Before we go into the details of the signals or best indicators for swing trading, you need to grasp what swing trading, as a trading technique, is all about.
As the name suggests, swing trading is a kind of game of swinging from purchasing stock to selling it. This method of trading aims to make profits out of small shifts in price.
This is implemented against the backdrop of wider market trends that may be present. If you wish to learn about swing trading, it is crucial to know about certain trading rules.
Swing traders buy stocks and sell stocks at highs and lows in a short span. This period may last for a few hours to a few days, but may also involve a few weeks.
The concept of swing trading lies in a place between day trading (in which trades are closed within a single trading day that they are bought in) and long-term investing or trading when investors remain with trades for longer periods.
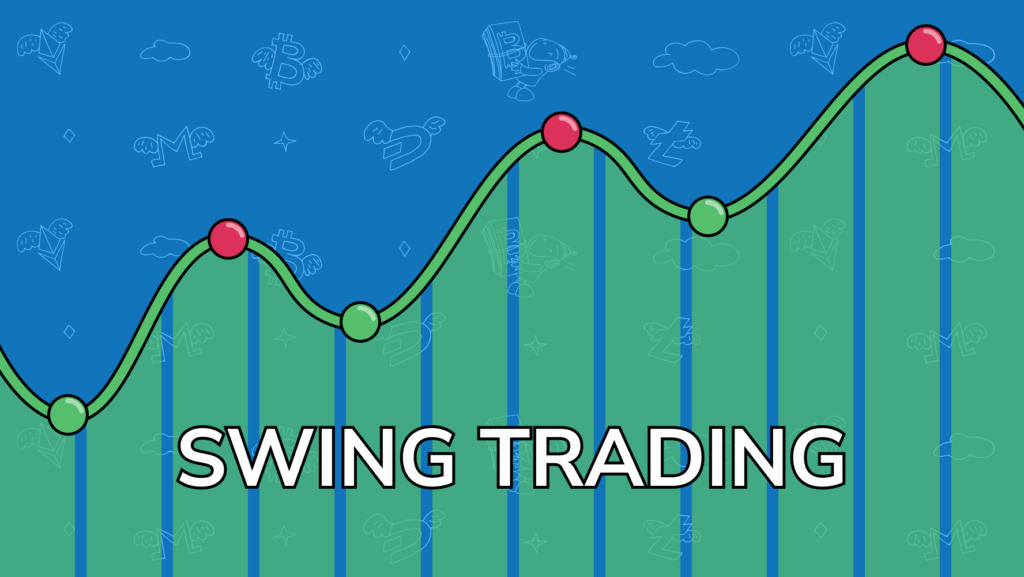
Intraday trading strategies may involve swing trading, as this tactic is all about buying stock at a trough, and then selling the stock at the peak of the price movement of the stock.
The Best Indicators for Swing Trading
Several traders use swing trading and they rely on technical and fundamental analysis to do so with potential success in mind.
The indicators, signals, or patterns, as they are often referred to by traders, used to create trading methods in swing trading may be seen as strategies.
Since past performance is not an accurate indicator of current success, traders employ different methods and look at various indicators with each trade they deal with. Furthermore, some strategies may work for one trader but not for another.
Here are seven of the strategies or best indicators for swing trading employed when swing traders are engaged in stock trading:
- Support and Resistance
While studying a price chart, support and resistance lines portray when prices are ready to shift their direction.
A support line displays a price range that goes below the real market price at any given time. The resistance line exhibits a range that is over the present market price.
When buyers of stocks become active, the support lines show a downward trend. If the market veers to a seller’s market, then the resistance range must be considered.
- Fibonacci Levels
The Fibonacci sequence gives rise to what is known as Fibonacci retracement levels. On a chart, these are horizontal lines that indicate where support and resistance will most likely show up. For swing traders engaged in intraday trading strategies, this aids traders in deciding on their entry and exit points.
- Catching Trends
Signals that help traders to identify trends in prices can lead to potential profits and prevent losses. This also helps in planning entry and exit points. Using these indicators, traders may hold positions till trends shift in a positive direction.
- Bollinger Indicators
Bollinger bands help traders to determine the direction of the general market. The direction in which the market is going is decided by prices.
Three bands display a lower level, a moving average level, and an upper level. When the market is overbought, prices move toward the upper level.
When the market is oversold, prices move toward the lower level. If prices are moderate, then the moving average is a good indicator for trading. Usually, a 20-day moving average is considered a viable trading timeframe.
- Breakout Swing
One of the best indicators for swing trading relies heavily on skills in technical analysis. The strategy gives signals about breakouts and traders may use support and resistance levels, trendlines, and more for indications of potential trading activity.
- Fading Trading Indicators
When traders use indications that imply trading against the dominant trading trend, they use fading trading strategies. Such indicators are used by experts as they may have risky outcomes.
- Breakdown Swing
Much like the contrarian approach of fading trading strategies, here, the trader goes in the opposite direction of the general market momentum. The trader takes low swings and goes short on their position to make profits.
Indicators to Help Traders
The best indicators for swing trading may be used by any traders looking to make earnings out of trading activity. However, some of these indicators are highly technical so due diligent preparation is essential before using them.
Additionally, all trading strategies may not be suitable for a variety of traders, and considerations for individual risk profiles and financial goals should be followed.
